Day 4
Our meeting was pretty short this morning; Joe is out this week so Matt Casella will be running our daily meetings. He had planned to show us a video about Imaging Science but a lack of computer speakers postponed that until tomorrow's meeting.
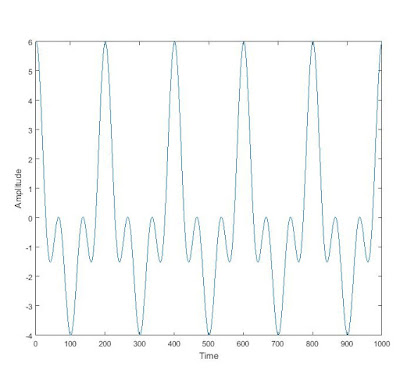
Today I expanded the previous day's learning of Fourier series with Fourier Transforms, a way of processing a waveform in the time domain (an amplitude vs. time plot) into the frequency domain (an amplitude vs. frequency plot). As I discussed in my previous post, any continuous waveform can be broken down into a series of sine and cosine waves; a frequency domain plot shows each frequency present in a more complex waveform compared to the amplitude of that frequency essentially showing "how much" of each frequency is present in the overall waveform. For example if we take a waveform with a known equation such as the graph of:
We know the frequencies of the components of this graph to be 10, 20, and 30 but a waveform obtained from experimental measurement would not be a perfect periodic cycle and we would not know the equation. A Fourier transform, however, can plot a data set in the frequency domain rather than the time domain and we can thereby determine the most prevalent constituent frequencies and their relative amplitudes:
A more complex waveform would most likely contain a wide spectrum of frequencies rather than a small number of discrete frequencies but many would have an amplitude close to zero and appear similar to "background noise" on the frequency domain plot.


No comments:
Post a Comment